Technology Excellence
Power BI: Transforming Business Intelligence in the Data-Driven Era
By Divya Khandelwal
Published on May 29, 2025
Introduction
In today’s rapidly evolving business landscape, the ability to transform raw data into actionable insights has become the cornerstone of competitive advantage. Microsoft Power BI stands at the forefront of this revolution, offering organizations of all sizes powerful tools to visualize data, share insights, and foster a culture of informed decision-making. This comprehensive guide explores how Power BI is reshaping business intelligence and driving digital transformation across industries.
Understanding the Power BI Revolution
Power BI represents a paradigm shift in how organizations approach data analysis. Unlike traditional business intelligence tools that often require specialized technical knowledge, Power BI democratizes data analysis through an intuitive interface that empowers users at all technical levels to create compelling visualizations and reports.
At its core, Power BI functions as a collection of services, apps, and connectors that work together to transform disparate data sources into coherent, visually immersive, and interactive insights. Whether data resides in Excel spreadsheets, cloud-based services, or on-premises databases, Power BI provides the connectivity and transformation capabilities needed to unify these sources into a comprehensive analytical view.
Why Organizations Need Power BI
The business value of Power BI extends beyond mere reporting capabilities:
- Unified Data View: Consolidate data from multiple sources into cohesive dashboards
- Democratized Access: Enable self-service analytics across all organizational levels
- Real-Time Insights: Make timely decisions with dashboards that update automatically
- Cost Efficiency: Reduce dependence on specialized IT resources for reporting
- Enhanced Collaboration: Share insights securely across teams and departments
- Mobile Accessibility: Access critical business metrics anywhere, anytime
Organizations that successfully implement Power BI often report dramatic improvements in operational efficiency, customer satisfaction, and revenue growth through more informed decision-making processes.
Technical Foundations: Mastering Power BI’s Core Capabilities
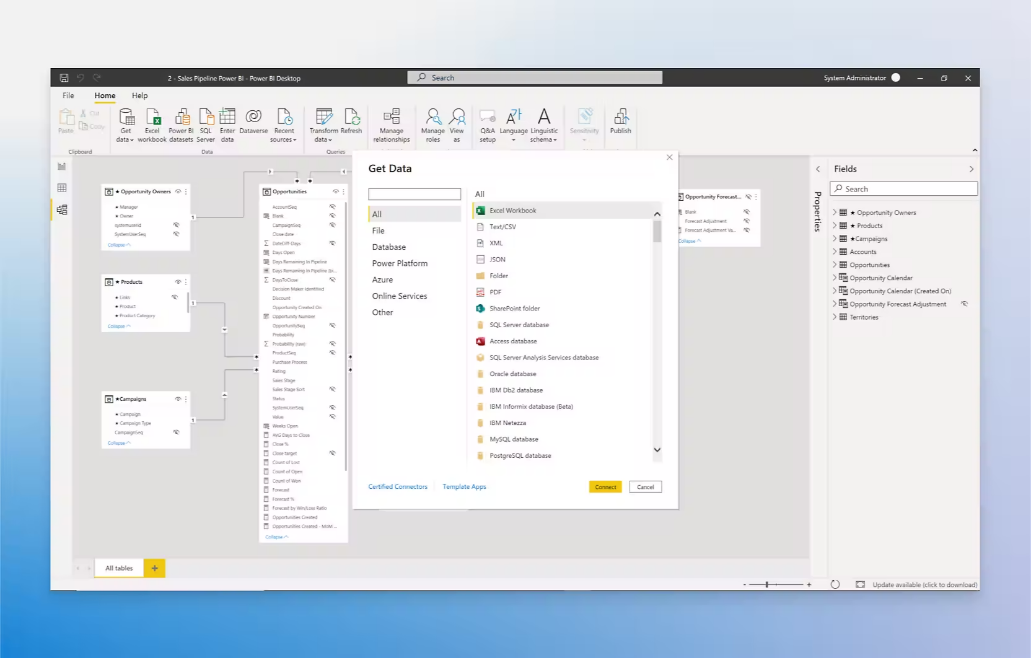
Data Modeling: The Backbone of Effective Analysis
Successful Power BI implementation begins with robust data modeling. This involves creating relationships between tables, defining hierarchies, and establishing calculated measures that enable multidimensional analysis. Advanced techniques like star schemas and composite models support complex analytical requirements while maintaining performance.
Key modelling capabilities include:
- Creation of one-to-many and many-to-many relationships
- Implementation of role-playing dimensions
- Development of date and time intelligence
- Establishment of security at the row level
- Creation of calculation groups for measure management

Source: Microsoft-products
The Language of Analysis: DAX vs. Power Query
Power BI offers two complementary approaches to data transformation:
Power Query (M) excels at data extraction and transformation before loading into the model. This ETL (Extract, Transform, Load) tool provides a graphical interface for cleaning, reshaping, and combining data sources through hundreds of built-in transformations.
Data Analysis Expressions (DAX) focuses on data analysis within the model. This formula language enables creation of calculated columns, measures, and tables that dynamically respond to user interactions with reports and visualizations.
Understanding when to apply each approach significantly impacts both model performance and analytical capabilities:
- Use Power Query for data cleaning, type transformations, and merging sources
- Implement DAX for business calculations, time intelligence, and interactive metrics
Optimization Strategies for Enterprise-Scale Performance
As data volumes grow and report complexity increases, performance optimization becomes critical. Key strategies include:
- Implementing incremental refresh policies for large datasets
- Creating aggregations for frequently accessed calculations
- Optimizing DAX formulas to reduce computational overhead
- Using appropriate storage modes (Import, DirectQuery, or Composite)
- Applying query folding techniques to push processing to source systems
Organizations implementing these best practices can maintain responsive dashboards even when working with billions of rows of data across multiple sources.
Integration Ecosystem: Power BI in the Modern Tech Stack

Source: Microsoft/power-bi-and-dynamics
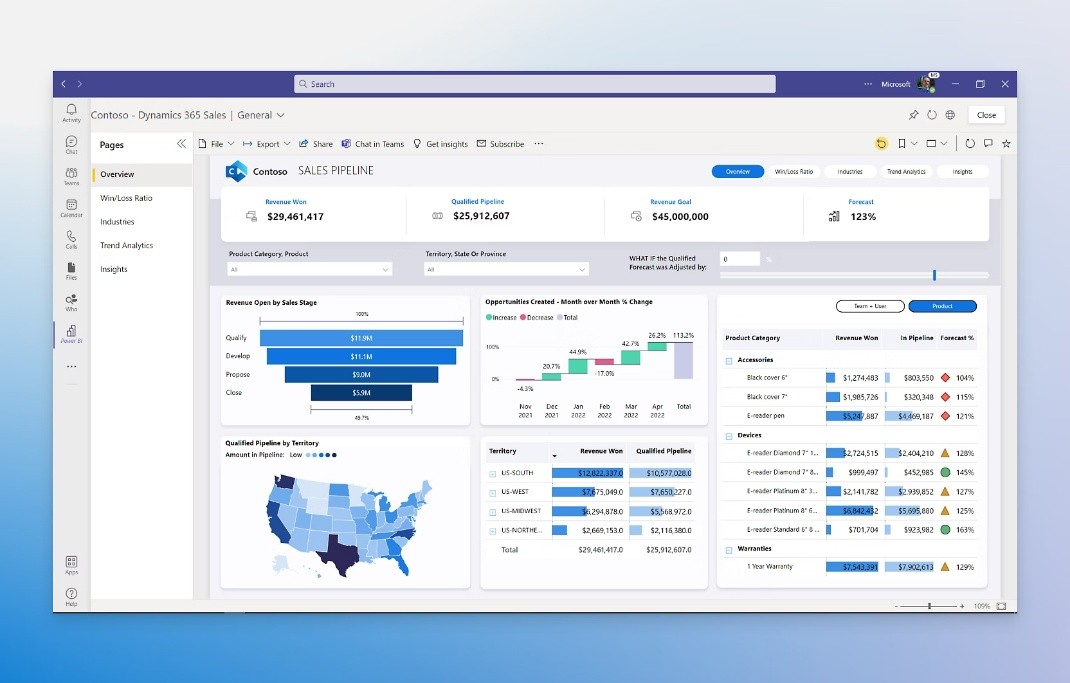
Creating End-to-End Data Pipelines
Power BI achieves its full potential when integrated into broader data workflows. Azure Data Factory serves as an ideal orchestration partner, enabling scheduled data movement, transformation, and loading processes that feed Power BI reports with fresh information.
This integration supports scenarios like:
- Automated data extraction from diverse enterprise systems
- Scheduled transformation of complex datasets
- Incremental loading of large historical datasets
- Centralized metadata management and lineage tracking
Enhancing Business Processes with Power Automate
The combination of Power BI with Power Automate creates intelligent workflows triggered by data insights:
- Automatic notifications when metrics cross defined thresholds
- Scheduled distribution of reports to stakeholders
- Process initiation based on analytical findings
- Data-driven document generation and distribution
These automated workflows close the loop between insight and action, ensuring that analytical discoveries translate immediately into operational responses.
Elevating Insights with AI and Machine Learning

Source: Microsoft fabric community
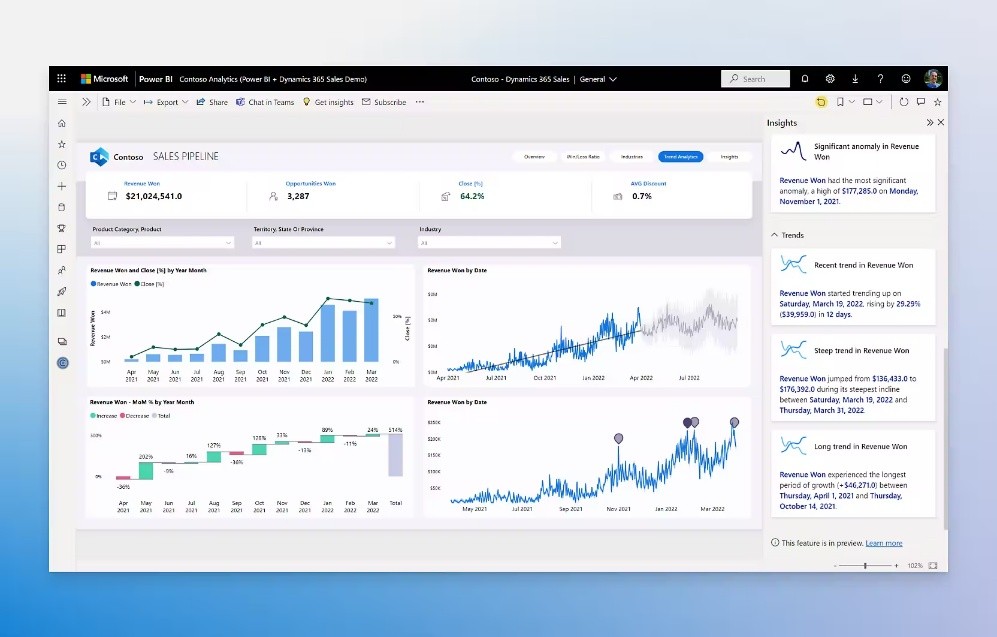
Power BI’s AI capabilities extend beyond traditional analytics into the realm of predictive and prescriptive insights:
- Automated machine learning for predictive forecasting
- Anomaly detection to identify unusual patterns
- Smart narrative generation for automated insight description
- Image analytics and text analytics for unstructured data
- Integration with Azure Machine Learning for custom models
These capabilities transform reports from historical records into forward-looking decision support tools that anticipate trends and suggest optimal actions.
Industry Transformations: Power BI Across Business Domains
Finance: Real-Time Visibility for Fiscal Excellence
Financial departments leverage Power BI to transform monthly closing processes into continuous monitoring capabilities:
- Cash flow dashboards with predictive forecasting
- Real-time budget variance analysis
- Interactive profit and loss statements
- Automated financial anomaly detection
- Scenario planning tools for financial strategy
These applications enable finance teams to shift from retrospective reporting to proactive financial management and strategic advisory roles.
Retail: Customer Insights Driving Revenue Growth
Retailers implement Power BI to develop comprehensive views of customer behavior and operational performance:
- Integrated sales and inventory analysis
- Customer segmentation and cohort analysis
- Basket analysis for cross-selling opportunities
- Demand forecasting with seasonal adjustment
- Store performance comparisons with geospatial visualization
These implementations often yield significant improvements in inventory turnover, marketing effectiveness, and customer lifetime value.
Healthcare: Data-Driven Patient Care
Healthcare organizations deploy Power BI to enhance patient outcomes while optimizing operational efficiency:
- Clinical pathway analysis and optimization
- Patient readmission risk prediction
- Resource utilization and capacity planning
- Quality metric tracking and improvement
- Population health management dashboards
These applications support the industry’s transition toward value-based care models that emphasize outcomes over procedures.
Manufacturing: Operational Excellence Through Analytics
Manufacturing entities utilize Power BI to optimize production processes and supply chain operations:
- Equipment effectiveness monitoring
- Predictive maintenance scheduling
- Quality control visualization and analysis
- Supply chain visibility and optimization
- Production scheduling and capacity planning
These implementations frequently deliver measurable improvements in equipment uptime, quality metrics, and production throughput.
Human Resources: People Analytics for Workforce Optimization
HR departments implement Power BI to develop data-driven approaches to talent management:
- Employee engagement tracking and analysis
- Turnover prediction and retention planning
- Recruitment funnel optimization
- Compensation analysis and planning
- Skills gap identification and development tracking
These applications transform HR from a transactional function into a strategic partner in organizational success.
The Road Ahead: Emerging Trends in Power BI
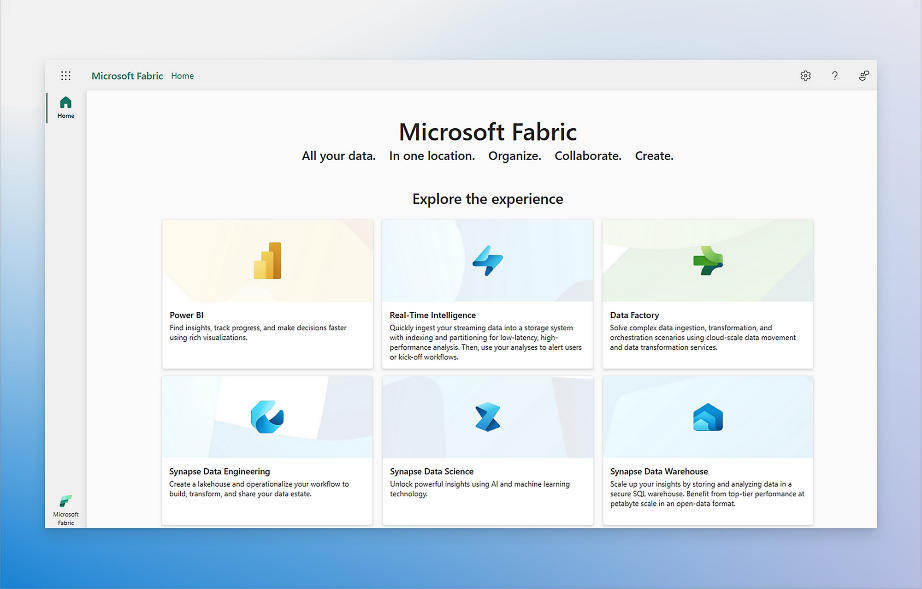
The Microsoft Fabric Integration

Source: Microsoft-products
Microsoft Fabric represents the next evolution in the Power BI journey, creating a unified analytics platform that combines data engineering, data science, and business intelligence capabilities. This integration promises:
- Simplified end-to-end data workflows
- Enhanced collaboration between technical and business users
- Unified governance across the data lifecycle
- Seamless scaling from personal to enterprise analytics
AI-Powered Analytics Transformation
As artificial intelligence capabilities continue to advance, Power BI is positioned to incorporate increasingly sophisticated AI functionality:
- Natural language interaction with data
- Automated insight discovery and explanation
- AI-assisted report design and optimization
- Embedded predictive capabilities throughout the platform
Data Governance for the Enterprise
As Power BI deployments mature, organizations increasingly focus on governance capabilities:
- Centralized management of semantic models
- Deployment pipelines for controlled releases
- Impact analysis for downstream dependencies
- Comprehensive security and compliance controls
- Data lineage tracking across the analytical lifecycle
The transition from isolated Excel spreadsheets to a comprehensive Power BI implementation represents more than a technology shift—it embodies a fundamental transformation in how organizations approach data and decision-making.
Successful organizations approach this journey incrementally:
- Start with clear business objectives rather than technical capabilities
- Build competency centers that support end-user enablement
- Establish governance frameworks that balance flexibility with control
- Foster a data culture that values evidence-based decision-making
- Continuously evolve analytical capabilities as business needs change
By following this approach, organizations can harness the full potential of Power BI to transform data from a byproduct of business operations into a strategic asset that drives innovation, efficiency, and competitive advantage in the digital economy.
In an era where data volumes continue to expand exponentially, Power BI provides the tools needed to distill this abundance into clarity, insight, and action—truly transforming the way businesses understand their past, manage their present, and plan for their future.
How Ambiment Can Help
At Ambiment, we specialize in accelerating Power BI adoption with:
- Pre-built, customizable Power BI templates
- End-to-end integration with your existing systems
- Training and enablement programs
- Scalable architecture and governance frameworks
We work closely with your teams to:
- Identify high-impact use cases aligned to business goals
- Rapidly deploy analytics solutions with minimal disruption
- Build intuitive dashboards for decision-makers
- Automate reporting processes for real-time visibility
- Ensure long-term success through continuous support and optimization
Whether you need to modernize reporting, enable real-time analytics, or implement predictive insights, Ambiment ensures your Power BI investment delivers maximum value with speed and precision.
Conclusion
In a world where data is growing exponentially, Power BI offers the clarity and capability to transform that data into strategic insight. With its rich feature set, integration flexibility, and powerful visualizations, Power BI is redefining what business intelligence means in the modern enterprise.
Partner with Ambiment to unlock the full potential of Power BI and drive your organization’s data-driven future.
For more information or to explore how we can help, get in touch with us. We believe even one conversation can lead to something amazing—and we’d love to hear from you!


